Electrocardiogram (ECG): interpretation of results
By: Administrator |
Tags: decoding ECG results, decoding ECG, ECG, ECG normal, Electrocardiogram, electrocardiogram decoding results | Comments: | June 24, 2021 Electrocardiography is a simple and informative study that determines heart rate indicators. A cardiograph records heart activity and records its parameters on paper. To evaluate them and draw conclusions about the patient’s condition, it is necessary to decipher the cardiogram. ECG interpretation is performed manually by comparing the characteristics of the graph with special tables or using computer programs to interpret the ECG results.
What concepts are used when decoding
Decoding an ECG is a rather complex process that requires deep knowledge from a specialist. During the assessment of the heart condition, the cardiogram parameters are measured mathematically. In this case, concepts such as sinus rhythm, heart rate, electrical conductivity and electrical axis, pacemakers and some others are used. By assessing these indicators, the doctor can clearly determine some parameters of the functioning of the heart.
Heart rate
Heart rate is a specific number of heart beats over a certain period of time. Typically an interval of 60 seconds is taken. On a cardiogram, heart rate is determined by measuring the distance between the tallest teeth (R - R). The recording speed of the graphic curve is usually 100 mm/s. By multiplying the recording length of one mm by the duration of the segment R – R, the heart rate is calculated. In a healthy person, the heart rate should be 60 - 80 beats per minute.
Sinus rhythm
Another concept included in the interpretation of the ECG is the sinus rhythm of the heart. During normal functioning of the heart muscle, electrical impulses arise in a special node, then spread to the area of the ventricle and atrium. The presence of sinus rhythm indicates normal functioning of the heart.
The cardiogram of a healthy person should show the same distance between the R waves throughout the entire recording. A deviation of 10% is allowed. Such indicators indicate the absence of arrhythmia in a person.
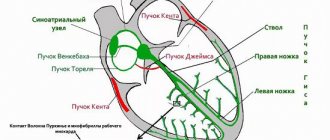
Conduction Paths
This concept defines a process such as the propagation of electrical impulses through the tissues of the heart muscle. Normally, impulses are transmitted in a certain sequence. Violation of the order of their transfer from one pacemaker to another indicates organ dysfunction and the development of various blockades. These include sinoatrial, intraatrial, atrioventricular, intraventricular blocks, as well as Wolff-Parkinson-White syndrome.
On an ECG, a specialist can see a violation of cardiac conduction
Electrical axis of the heart
When deciphering a cardiogram of the heart, the concept of the electrical axis of the heart is taken into account. This term is widely used in cardiological practice. When interpreting an ECG, this concept allows a specialist to see what is happening in the heart. In other words, the electrical axis is the totality of all biological and electrical changes within an organ.
An electrocardiogram allows you to visualize what is happening in a specific area of the heart muscle using a graphic image obtained by transmitting impulses from electrodes to a special device.
The position of the electrical axis is determined by the doctor using special diagrams and tables or by comparing the QRS complexes, which are responsible for the process of excitation and contraction of the cardiac ventricles.
If ECG indicators indicate that the R wave in lead III has a smaller amplitude than in lead I, we are talking about a deviation of the cardiac axis to the left. If in lead III the R wave has a greater amplitude than in lead I, it is customary to speak of axis deviation to the right. Normal indicators in the cardiogram table are the highest R wave in lead II.
Teeth and intervals
On the cardiogram itself obtained during the study, the waves and intervals are not indicated. They are needed only for the specialist doing the decryption.
Prongs:
- P – determines the beginning of contraction of the atrium;
- Q, R, S – belong to the same type, coincide with the contraction of the ventricles;
- T – time of inactivity of the ventricles of the heart, that is, their relaxation;
- U - rarely noted on the cardiogram; there is no consensus on its origin.
For ease of interpretation, the cardiogram is divided into intervals. On the tape you can see straight lines that run clearly in the middle of the tooth. They are called isolines or segments. When making a diagnosis, indicators of the P – Q and S – T segments are usually taken into account.
In turn, one interval consists of segments and teeth. The length of the interval also helps assess the overall picture of heart function. The intervals P - Q and Q - T have diagnostic significance.
Important! You cannot read a cardiogram yourself without certain knowledge. Decoding of the cardiogram is carried out exclusively by a specialist.
ECG interpretation algorithm
There is a scheme for deciphering an ECG with a sequential study of the main aspects of heart function:
- sinus rhythm;
- Heart rate;
- rhythm regularity;
- conductivity;
- EOS;
- analysis of teeth and intervals.
Sinus rhythm is a uniform heartbeat rhythm caused by the appearance of an impulse in the AV node with gradual contraction of the myocardium. The presence of sinus rhythm is determined by deciphering the ECG using P wave indicators.
Also in the heart there are additional sources of excitation that regulate the heartbeat when the AV node is disturbed. Non-sinus rhythms appear on the ECG as follows:
- Atrial rhythm - P waves are below the baseline;
- AV rhythm – P is absent on the electrocardiogram or comes after the QRS complex;
- Ventricular rhythm - in the ECG there is no pattern between the P wave and the QRS complex, while the heart rate does not reach 40 beats per minute.
When the occurrence of an electrical impulse is regulated by non-sinus rhythms, the following pathologies are diagnosed:
- Extrasystole is premature contraction of the ventricles or atria. If an extraordinary P wave appears on the ECG, as well as when the polarity is deformed or changed, atrial extrasystole is diagnosed. With nodal extrasystole, P is directed downward, absent, or located between QRS and T.
- Paroxysmal tachycardia (140-250 beats per minute) on the ECG can be presented in the form of an overlay of the P wave on the T wave, standing behind the QRS complex in standard leads II and III, as well as in the form of an extended QRS.
- Flutter (200-400 beats per minute) of the ventricles is characterized by high waves with difficult to distinguish elements, and with atrial flutter, only the QRS complex is distinguished, and sawtooth waves are present in place of the P wave.
- Flicker (350-700 beats per minute) on the ECG is expressed in the form of inhomogeneous waves.
Heart rate
The interpretation of the ECG of the heart must contain heart rate indicators and is recorded on tape. To determine the indicator, you can use special formulas depending on the recording speed:
- at a speed of 50 millimeters per second: 600/ (number of large squares in the RR interval);
- at a speed of 25 mm per second: 300/ (number of large squares between RR),
Also, the numerical indicator of the heartbeat can be determined by the small cells of the RR interval, if the ECG tape was recorded at a speed of 50 mm/s:
- 3000/number of small cells.
The normal heart rate for an adult is between 60 and 80 beats per minute.
Regularity of rhythm
Normally, the RR intervals are the same, but an increase or decrease of no more than 10% from the average value is allowed. Changes in the regularity of the rhythm and increased/decreased heart rate can occur as a result of disturbances in automatism, excitability, conductivity, and contractility of the myocardium.
When the automatic function is impaired, the following interval indicators are observed in the heart muscle:
- tachycardia - heart rate is in the range of 85-140 beats per minute, a short period of relaxation (TP interval) and a short RR interval;
- bradycardia - heart rate decreases to 40-60 beats per minute, and the distances between RR and TP increase;
- arrhythmia – different distances are tracked between the main heartbeat intervals.
Conductivity
To quickly transmit an impulse from the source of excitation to all parts of the heart, there is a special conduction system (SA and AV nodes, as well as the His bundle), the violation of which is called blockade.
- How to decipher an ECG analysis, norms and deviations, pathologies and diagnostic principles
There are three main types of blockades - sinus, intraatrial and atrioventricular.
With sinus block, the ECG shows a violation of impulse transmission to the atria in the form of periodic loss of PQRST cycles, while the distance between RRs increases significantly.
Intraatrial block is expressed as a long P wave (more than 0.11 s).
Atrioventricular block is divided into several degrees:
- I degree – prolongation of the PQ interval by more than 0.20 s;
- II degree – periodic loss of QRST with an uneven change in time between complexes;
- III degree - the ventricles and atria contract independently of each other, as a result of which there is no connection between P and QRST in the cardiogram.
Electric axis
EOS displays the sequence of impulse transmission through the myocardium and normally can be horizontal, vertical and intermediate. In ECG interpretation, the electrical axis of the heart is determined by the location of the QRS complex in two leads - aVL and aVF.
In some cases, axis deviation occurs, which in itself is not a disease and occurs due to an enlargement of the left ventricle, but, at the same time, may indicate the development of pathologies of the heart muscle. As a rule, the EOS deviates to the left due to:
- ischemic syndrome;
- pathology of the valve apparatus of the left ventricle;
- arterial hypertension.
A tilt of the axis to the right is observed with enlargement of the right ventricle with the development of the following diseases:
- pulmonary stenosis;
- bronchitis;
- asthma;
- pathology of the tricuspid valve;
- congenital defect.
Reading a cardiogram
How to decipher a cardiogram of the heart? This question is asked by many patients who have had to deal with the electrocardiography procedure. It is very difficult to do this yourself, because decrypting data has a lot of nuances. And if you read certain disturbances in the activity of the heart in your cardiogram, this does not at all mean the presence of this or that disease.
A cardiologist reads a cardiogram
Prongs
In addition to taking into account intervals and segments, it is important to monitor the height and duration of all teeth. If their fluctuations do not deviate from the norm, this indicates healthy functioning of the heart. If the amplitude is deviated, we are talking about pathological conditions.
Norm of waves on an ECG:
- P – should have a duration of no more than 0.11 s., a height within 2 mm. If these indicators are violated, the doctor can make a conclusion about a deviation from the norm;
- Q – should not be higher than a quarter of the R wave, wider than 0.04 s. Particular attention should be paid to this tooth; its deepening often indicates the development of myocardial infarction in a person. In some cases, tooth distortion occurs in people with severe obesity;
- R – when deciphered, it can be traced in leads V5 and V6, its height should not exceed 2.6 mV;
- S is a special tooth for which there are no clear requirements. Its depth depends on many factors, for example, weight, gender, age, body position of the patient, but when the tooth is too deep, we can talk about ventricular hypertrophy;
- T – must be at least a seventh of the R wave.
In some patients, after the T wave on the cardiogram, a U wave appears. This indicator is rarely taken into account when making a diagnosis and does not have any clear standards.
Segments and Intervals
Intervals and segments also have their own normal values. If these values are violated, the specialist usually gives a referral to the person for further research.
Normal indicators:
- The ST segment should normally be located directly on the isoline;
- The QRS complex should not last more than 0.07 - 0.11 s. If these indicators are violated, various pathologies of the heart are usually diagnosed;
- the PQ interval should last from 0.12 milliseconds to 0.21 seconds;
- The QT interval is calculated taking into account the heart rate of a particular patient.
Segments and Intervals
Important! The ST segment in leads V1 and V2 sometimes runs slightly above the baseline. The specialist must take this feature into account when deciphering the ECG.
What does an ECG look like normally and with pathology?
Electrocardiogram parameters in adult men and women are presented in the table and look like this:
| ECG parameters | Norm | Deviation | Probable cause of deviation |
| RRR distance | Even spacing between teeth | Uneven distance |
|
| Heart rate | 60-90 beats/min at rest | Below 60 or above 90 beats/min at rest |
|
| Atrial contraction - R wave | Directed upward, outwardly resembles an arc. The height is about 2 mm. May not be present in ΙΙΙ, AVL, V1. |
|
|
| PQ interval | A straight line between the PQ teeth with an interval of 0.1-0.2 seconds. |
|
|
| QRS complex | Length 0.1 second - 5 mm, then T wave and straight line. |
|
|
| Q wave | Absent or directed downward with a depth equal to 1/4 of the R wave | Depth and/or width exceeding normal |
|
| R wave | Height 10-15 mm, pointing upward. Present in all leads. |
|
|
| S wave | Depth 2-5 mm, sharp end pointing down. |
| Left ventricular hypertrophy. |
| ST segment | Coincides with the distance between the ST teeth. | Any deviation of the horizontal line greater than 2 mm. |
|
| T wave | The height of the arc is up to 1/2 of the R wave or coincides (in the V1 segment). Direction - up. |
|
|
What kind of cardiogram should a healthy person have?
Indications of a good cardiogram for an adult:
- ECG changes in coronary artery disease (introductory review)
| Prong | Lead | Description |
| R |
| Positive. |
| R | AVR | Negative. |
| T | AVR | Negative. |
| R | V1-V4 | Increase in amplitude. |
| R | V5-V6 | Reducing the swing of oscillations. |
| S | V1-V6 | Reduction until complete disappearance. |
| RST segment | On the isoline. | Error no more than 0.5 mm |
The video compares the cardiogram of a healthy and sick person and provides the correct interpretation of the data obtained. Taken from the channel “Life of a Hypertensive”.
Indicators in adults
An example of a normal ECG in adults:
| ECG indicators | Norm |
| QRS | 0.06-0.1 sec |
| P | 0.07-0.11 sec |
| Q | 0.03 sec |
| T | 0.12-0.28 sec |
| PQ | 0.12-0.20 sec |
| Heart rate | 60-80 beats/min |
Indicators in children
Electrocardiogram parameters in children:
| ECG indicators | Norm |
| QRS | 0.06-0.1 sec |
| P | No more than 0.1 sec |
| Q | 0.2 sec |
| QT | No more than 0.4 sec |
| Heart rate |
|
Decryption features
To record a cardiogram, special sensors are attached to a person’s body, which transmit electrical impulses to an electrocardiograph. In medical practice, these impulses and the paths they take are called leads. Basically, 6 main leads are used during the study. They are designated by the letters V from 1 to 6.
The following rules for deciphering a cardiogram can be distinguished:
- In lead I, II or III, you need to determine the location of the highest region of the R wave, and then measure the gap between the next two waves. This number should be divided by two. This will help determine the regularity of your heart rate. If the gap between the R waves is the same, this indicates normal contraction of the heart.
- After this, you need to measure each tooth and interval. Their standards are described in the article above.
Most modern devices automatically measure your heart rate. When using older models, this has to be done manually. It is important to consider that the ECG recording speed is usually 25 – 50 mm/s.
Heart rate is calculated using a special formula. At an ECG recording speed of 25 mm per second, it is necessary to multiply the R - R interval distance by 0.04. In this case, the interval is indicated in millimeters.
At a speed of 50 mm per second, the R - R interval must be multiplied by 0.02.
For ECG analysis, 6 of 12 leads are usually used, since the next 6 duplicate the previous ones.
Normal values in children and adults
In medical practice, there is the concept of an electrocardiogram norm, which is typical for each age group. Due to the anatomical characteristics of the body in newborns, children and adults, the study indicators are slightly different. Let's take a closer look at them.
ECG norms for adults can be seen in the figure.
Normal ECG in adult patients
A child's body is different from an adult's. Due to the fact that the organs and systems of the newborn are not fully formed, electrocardiography data may differ.
In children, the mass of the right ventricle of the heart prevails over the left ventricle. Newborns often have a high R wave in lead III and a deep S wave in lead I.
The ratio of the P wave to the R wave in adults is normally 1:8; in children, the P wave is tall, often more pointed, in relation to R is 1:3.
Due to the fact that the height of the R wave is directly related to the volume of the ventricles of the heart, its height is lower than in adults.
What affects the accuracy of indicators
Sometimes the results of a cardiogram may be erroneous and differ from previous studies. Errors in results are often associated with many factors. These include:
- incorrectly attached electrodes. If the sensors are poorly attached or become dislodged during an ECG, the test results can be seriously affected. That is why the patient is recommended to lie still during the entire period of taking the electrocardiogram;
- extraneous background. The accuracy of the results is often influenced by extraneous devices in the room, especially when the ECG is performed at home using mobile equipment;
- smoking, drinking alcohol. These factors affect blood circulation, thereby changing the cardiogram parameters;
- meal. Another reason that affects blood circulation and, accordingly, the correctness of indicators;
- emotional experiences. If the patient is worried during the study, this may affect the heart rate and other indicators;
- Times of Day. When conducting a study at different times of the day, the indicators may also differ.
The specialist must take into account the above-described nuances when interpreting the ECG; if possible, they should be excluded.
Dangerous diagnoses
Diagnostics using electrical cardiography helps to identify many cardiac pathologies in a patient. Among them are arrhythmia, bradycardia, tachycardia and others.
Cardiac conduction disorder
Normally, the electrical impulse of the heart passes through the sinus node, but sometimes a person has other pacemakers. In this case, symptoms may be completely absent. Sometimes conduction disturbances are accompanied by rapid fatigue, dizziness, weakness, surges in blood pressure and other symptoms.
Cardiac conduction abnormalities on ECG
In asymptomatic cases, special therapy is often not required, but the patient should undergo regular examinations. Many factors can negatively affect the functioning of the heart, which entails disruption of depolarization processes, decreased myocardial nutrition, development of tumors and other complications.
Bradycardia
A common type of arrhythmia is bradycardia. The condition is accompanied by a decrease in heart rate below normal (less than 60 beats per minute). Sometimes such a rhythm is considered normal, which depends on the individual characteristics of the body, but more often bradycardia indicates the development of one or another heart pathology.
Features of the ECG in a patient with bradycardia can be seen in the figure.
Bradycardia on the cardiogram
There are several types of disease. For latent bradycardia without obvious clinical signs, therapy is usually not required. In patients with severe symptoms, the underlying pathology causing the heart rhythm disturbance is treated.
Extrasystole
Extrasystole is a condition accompanied by untimely contraction of the heart. In the patient, extrasystole causes a sensation of a strong cardiac impulse, a sensation of cardiac arrest. At the same time, the patient experiences fear, anxiety, and panic. The prolonged course of this condition often leads to impaired blood flow, entailing angina pectoris, fainting, paresis and other dangerous symptoms.
It is believed that with extrasystole no more than 5 times per hour there is no danger to health, but if attacks occur more often, appropriate treatment should be carried out.
Sinus arrhythmia
The peculiarity of this disorder is that when the heart rate changes, the work of the organ remains coordinated, the sequence of contractions of the heart parts remains normal. Sometimes, in a healthy person, sinus arrhythmia can be observed on an ECG under the influence of factors such as food intake, anxiety, and physical activity. In this case, the patient does not experience any symptoms. Arrhythmia is considered physiological.
In other situations, this disorder may indicate pathologies such as coronary heart disease, myocardial infarction, myocarditis, cardiomyopathy, and heart failure.
Patients may notice symptoms in the form of headaches, dizziness, nausea, heart rhythm disturbances, shortness of breath, and chronic fatigue. Treatment of sinus arrhythmia involves getting rid of the underlying pathology.
Norm and signs of arrhythmia on a cardiogram
Important! In children, sinus arrhythmia often occurs during adolescence and may be associated with hormonal imbalances.
Tachycardia
With tachycardia, the patient experiences an increase in heart rate, that is, more than 90 beats per minute. Normally, tachycardia develops in people after intense physical exertion; sometimes stress can cause palpitations. In a normal state, the rhythm is normalized without consequences for health.
It is important to note that tachycardia is not an independent disease and does not occur on its own. This disorder always acts as a secondary symptom of some pathology. This means that treatment should be aimed at the disease causing the increased heart rate.
Pathologies during ECG
The ECG is normal if all indicators are within a certain range. Otherwise, they speak of a deviation from the norm, but the presence of pathology must be determined by a doctor. Heart cardiogram decoding makes it possible to identify the following pathologies:
- Sinus arrhythmia suggests a physiological disorder, but is normal in children and adolescents.
- Atrial fibrillation can occur periodically or constantly, and is accompanied by a feeling in the patient of heart fluttering, anxiety, and panic.
- Sinus bradycardia, when the heart rate is about 50 beats per minute, is observed in healthy people during sleep and in athletes.
- Sinus tachycardia manifests itself in excess of the standard heart rate (90 beats per minute). In healthy people, it is temporarily observed during physical and emotional stress, drinking strong coffee, alcohol, and energy drinks. The pathology is indicated by a rapid heartbeat at rest.
- Extrasystole is characterized by a chaotic heartbeat, too frequent or too rare. Patients feel tremors behind the breastbone, tingling, empty stomach or sudden fear.
- Paroxysmal tachycardia manifests itself with periodic rapid heartbeat, while the pulse can reach 200-250 beats per minute. The duration of the attack can be from several minutes to several days.
- WPW syndrome is accompanied by a lack of air, a feeling of cardiac arrest for a moment, and a strong heartbeat.